HARVEST FUND · PRODUCT DESIGN INTERNSHIP · 2026
From 625 Workflows to One Decision View
A single-screen operations cockpit for identifying risk, locating ownership, and taking action.
Harvest Fund was turning an early concept into an internal system for managing fund operations.
Around 7 managers needed one shared view of 625 workflows to spot urgent risks, identify owners, and coordinate action.
45
Day Phase 1
7
managers (user)
99
Employees
625
Workflows


HERO PRODUCT IMAGE
The challenge
Signals were fragmented across systems, spreadsheets, and verbal communication.
Phase 1 needed one stable view with no drill-down pages.
Scope Future Exploration
A buildable, single-screen management dashboard using existing data, rules, and operational workflows.
AI explanations, staffing simulations, process tracking, and review—scoped beyond Phase 1.
My role
Synthesizing internal workshops, stakeholder interviews, and benchmark research
Translating management scenarios into structured functional hypotheses
Partnering with product, engineering, and operations stakeholders to prioritize shared capabilities
Designing interactions for risk monitoring, contextual detail, workforce visibility, and decision traceability
Exploring future human-AI workflows beyond the Phase 1 scope
CHALLENGE 01 · PRODUCT SCOPE
One Platform, Two Time Horizons
Deliver a usable Phase 1 in 45 days while preserving a path toward a reusable operations platform.
Management gap
Metrics showed that something changed, but not what mattered first, who owned it, or what action should happen next.
• Fragmented signals
• Minute-level changes
• No consistent action path
Interface constraints
• One stable screen
• No Phase 1 drill-down
• Changing fields and units
• Fixed scanning positions

Challenge
Vague needs and frequent requirement changes.
Solution:
We used AI-assisted rapid prototyping to turn vague requirements into interactive screens.
For example:
Stakeholder feedback revealed a need for fast, minute-level decisions, leading us to remove long-term and search features and prioritize real-time risk response.
Solution:
DELIVER NOW
Buildable Phase 1
Stable table, risk prioritization, workforce visibility, in-context details, and traceability.
Shared
foundation
BUILD TOWARD
Future decision support
AI explanations, staffing simulations, process tracking, feedback, and reusable configurations.
PRODUCT VISION
A buildable operational view today, supported by a reusable decision framework for tomorrow.
How might we turn fragmented risk signals into an actionable decision within one stable view?
CHALLENGE 02 · SYSTEM STRUCTURING
From 80+ Ideas to a Closed-Loop Capability System
I gave the team a common structure for comparing opportunities, constraints, and implementation value.
15+ Workshops / Interviews
Management priorities and shared scenarios
8+ Benchmarks
Patterns from FineBI and management tools
42 Leadership-Validated Functions
✓ Checked and prioritized by product and operations leads.
Cross-functional review
Value, reuse, data availability, and feasibility
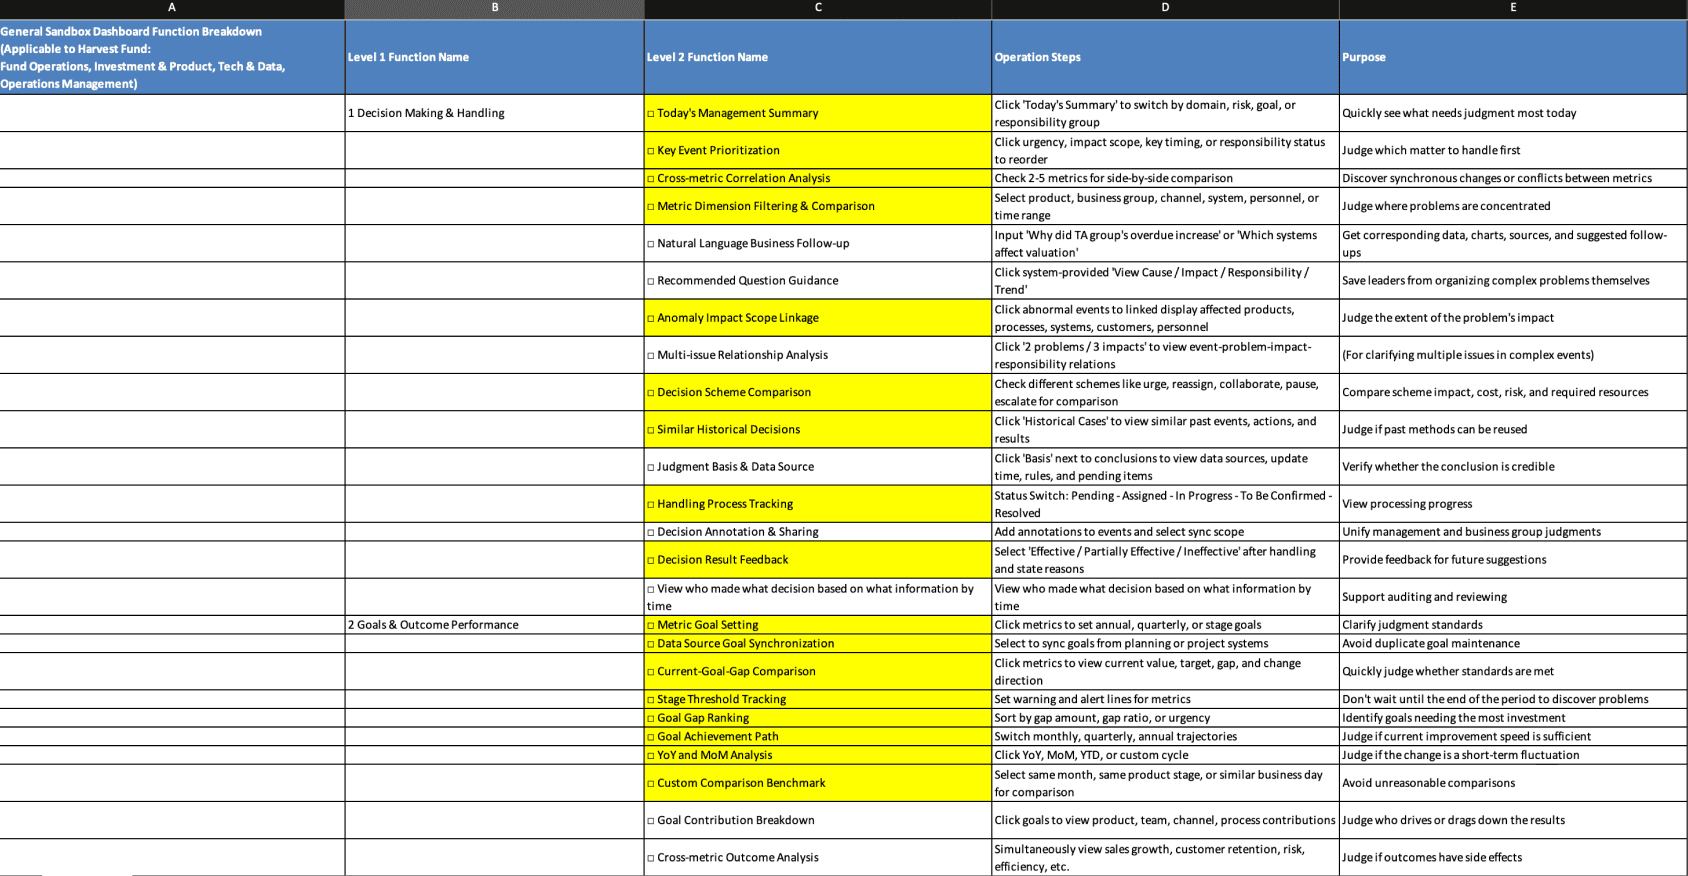
A Closed-Loop Decision System
The 42 functions were not isolated—they formed a complete loop from detection to action and learning.
Detect Daily summary surfaces anomalies.
↓
Assess Workload and risk views confirm severity.
↓
Act Compare options, simulate support, and confirm manually.
↓
Learn Track thresholds, verify outcomes, and retain history.
80+
Functional hypotheses
Created from interviews, workshops,
and benchmarks.
→
42
Leadership-Prioritized Functions
Selected by product and operations leads across five business domains.
→
5
Reusable Capabilities in the Final Design
Consolidated from related functions into reusable interaction patterns.
Five capability areas Five Business Domains
Workload heatmap
Risk matrix
In-context details
Action traceability
Outcome feedback
Decision & Response · Goals & Performance · Safety & Quality · Capacity & Resources · Development Initiatives
My contribution
I made different scenarios comparable by mapping each one to a management problem, interaction, and intended value.
CHALLENGE 03 · INTERACTION DESIGN
Designing for Fast Scanning as Requirements Kept Changing
Managers needed to compare dozens of exceptions while fields, formulas, and risk types continued to evolve.
What We Explored

Iteration 2 - Multi-row components
Two to four rows per event disrupted vertical scanning.

Iteration 3 - Card-based tables
Weak comparison and difficult expansion as fields changed.

Iteration 1 - Expandable cards
Too little visible at once; repeated opening and closing.
What We Learned
1. Expertise Changes What “Usable” Means
Generic UX instincts suggested more whitespace and visualization. However, seven data-literate operations leads preferred dense, stable rows for faster comparison and anomaly scanning.
2. Reuse Is an Enterprise Requirement
A component is not successful only because it is clear. It must also accommodate new fields, formulas, and scenarios without rebuilding the workflow.
FINAL DIRECTION · STABLE SINGLE-ROW TABLE

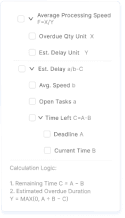
Final Direction · Reusable Parent–Child Table
Progressive Parent–Child Rows
Collapsed rows show only essential parent fields for fast comparison. Expanding reveals child fields, formulas, and relationships on demand.
Extensible Field Hierarchy
New fields and formulas can be added within the same structure without redesigning the table.
Stable Scanning
Consistent columns, units, and row alignment reduce information overload and preserve scanning efficiency.
In-context details
Hover previews the event; click keeps the panel open for cause, impact, owner, notes, and next action. Reserve a small optional image here if space allows.
CHALLENGE 04 · MANAGEMENT DECISION SUPPORT
From Risk Prioritization to Responsible Action
Across 625 workflows, leaders needed a clear starting point and a way to connect priority issues with the people who could act.
Where should I look first?
If capacity is constrained, who may be able to help?
01 · RISK PRIORITIZATION
Where Should Leaders Look First?
Hundreds of workflow signals competed for attention. Leaders could see individual metrics, but not where to begin.
Initial direction
We considered an AI-generated or rule-generated narrative summary.
Why it was not enough
A paragraph repeated metrics but concealed how risks were distributed and made clusters difficult to compare.
My decision · Risk Matrix
I proposed a deterministic matrix that made risk concentration and relative priority visible at a glance.
• Identify high-priority clusters
• Compare relative severity
• Continue to related issues
Linked table interaction
Selecting a high-risk cell highlights the corresponding records in the main table, preserving the connection between summary and operational detail.
02 · OWNERSHIP & CAPACITY
From Detecting Issues to Managing Capacity
Detecting an exception was only the beginning. Managers also needed to locate ownership and respond when teams were understaffed.
A · Issue-Monitoring View
Goal: Detect operational exceptions
Object: Workflow, metric, or risk event
Question: What is going wrong?
End point: The issue is identified
→
B · Management Decision View
Goal: Connect exceptions to ownership and capacity
Object: Workflow, responsible person, and available staff
Question: Who owns it, and who may be able to help?
End point: Candidates reviewed by a manager
Reframing the problem
I reframed the question from “Which workflow is at risk?” to “Who owns it, and who may have capacity to act?”
My decision · Responsibility to person
I connected workflow risk with individual workload and availability.
• Locate the responsible person
• See where workload is concentrated
• Identify potential support capacity
• Continue to manager confirmation
Stakeholders expected the actionable set to typically remain within approximately 11–12 employees, making a compact named-person view practical.
Decision boundary
The view identifies potential support candidates. It does not automatically decide who should be reassigned.


Responsive priority
Expanded states preserve team context. Compact states prioritize employees with available capacity.
CONNECTING THE TWO DECISIONS
1 · Prioritize
Scan risk clusters
→
2 · Link
Highlight related table rows
→
3 · Understand
Cause, impact, owner
→
4 · Capacity?
Only when staffing contributes
→
5 · Review people
Find potential support
→
6 · Confirm
Manager assigns and tracks
I translated stakeholder discussions into two management questions, replaced a narrative summary direction with a deterministic risk matrix, introduced a responsibility-to-person capacity view, and connected both through a conditional path to manager-confirmed action.
Design reflection
Named visibility supports accountability, but requires clear permissions, freshness, and separation from employee performance ranking.
OUTCOME · CLOSING THE LOOP
From Operational Action to Reusable Experience
The workflow continues after reassignment—tracking execution, comparing expected and actual outcomes, and capturing decisions for future incidents.
01 · Track
Owner, duration, recurrence, recovery state
→
02 · Compare
Before, expected, and actual results
→
03 · Confirm
Resolved, unresolved, or monitor
→
04 · Learn
Save the confirmed case for future reference

Show workload changes, remaining tasks, recovery time, manager confirmation, and Save Experience in one continuous sequence.
ENTRY POINT · FROM SCANNING TO ACTION
Reveal context without leaving the main view
Hover provides a quick preview. Click keeps the event panel open so managers can review the cause, impact, owner, communication history, and related cases before starting tracking.
Initial Feedback
“We can just call it out across the office.”
Underlying Need
Verbal coordination was fast but left no record of decisions, ownership, or follow-up.
Design Response
We added traceable annotations to the hover card as a pilot, aligned with product and operations teams.
Cause & impact
Owner
Notes
Historical case
Start tracking
VIDEO / IMAGE 02 · TRACK

Track What the Data Can Support
I first proposed a resolution timeline, but the PM confirmed there was no data for intermediate progress. I shifted to observable signals: keep unresolved or recurring issues visible with an owner and elapsed time, and flag metrics that remain abnormal. The revised approach was accepted for a trial.
03 · COMPARE → CONFIRM → REUSE
Primary evidence: Before / Target / Actual → Resolved / Unresolved / Monitor → Recommend similar case → Save Experience.
What We Learned
User Feedback Is Evidence, Not the Answer.
Users described how work happens today; I examined what the system must preserve tomorrow. Verbal coordination was fast, but it could not support accountability, continuity, or follow-up. Instead of forcing a permanent solution, we introduced traceable annotations as a pilot.
A decision is not complete when work is reassigned. It is complete when the outcome is verified by a manager and recorded for future use.
WHAT CHANGED BECAUSE OF MY WORK
80+
Functional hypotheses structured across five management domains.
42
Reusable functions shortlisted through product and engineering review.
5
Capabilities incorporated into the general dashboard design.
1 shared loop
Context → action → tracking → confirmation → experience.
Capability direction: shortlisted · Detailed interaction: future-state prototype · Production impact: not yet measured
NEXT STEP · AI-ASSISTED DESIGN OPERATIONS · IN PROGRESS
Scaling Exploration Without Breaking the System
Why Explore This?
During my internship, requirements in this 0→1 project changed faster than traditional design handoffs could keep up. Natural-language prototyping helped me test ideas quickly, but every new direction still required a reviewable draft.
My next step is to explore a workflow where product teams use approved components and clear usage rules to create those drafts, with each design choice visible for review.
User flow + selected capability logic
↓
Components + tokens + states + breakpoints
↓
GPT-6 constrained composition
↓
Designer review + editable responsive screens
I am testing a GPT-6-assisted workflow that turns scenario logic into editable Figma directions while remaining constrained by approved responsive components.
